27 Jul 2018
Statistics
Undergraduate applications for 2017-18 admissions
The Universities Admissions Centre (UAC) processes applications for tertiary study on behalf of 37 institutions, mainly in NSW and the ACT.
UAC received 82,974 applications for undergraduate study in the 2017-18 admissions period.
A total of 115,781 offers were made to these applicants.*
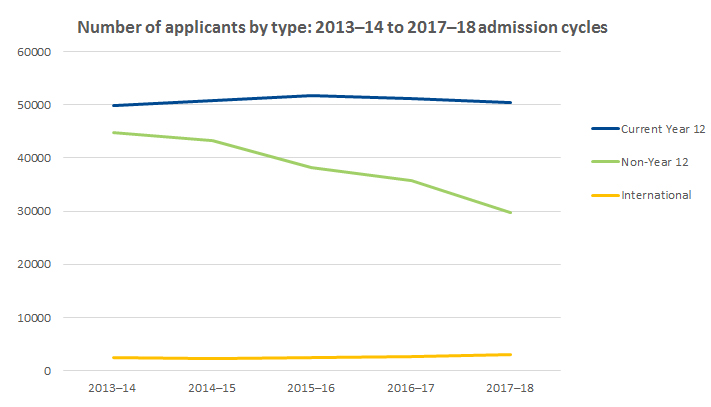
Applications and offers by applicant type
Applicants are divided into three types: current Year 12s, non-Year 12s and international.
The following chart shows applications by applicant type for the last five years.
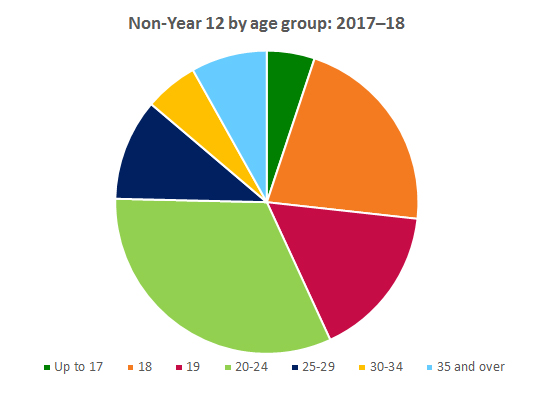
Age analysis
Almost all current Year 12 applicants (those with an Australian Year 12 qualification like the HSC or other state equivalents) were 19 years old and under (99.7%). Around three-quarters (75.3%) of non-Year 12 applicants were 24 years old and under.
The breakdown by age group for applications by non-Year 12 applicants is shown in the following chart.
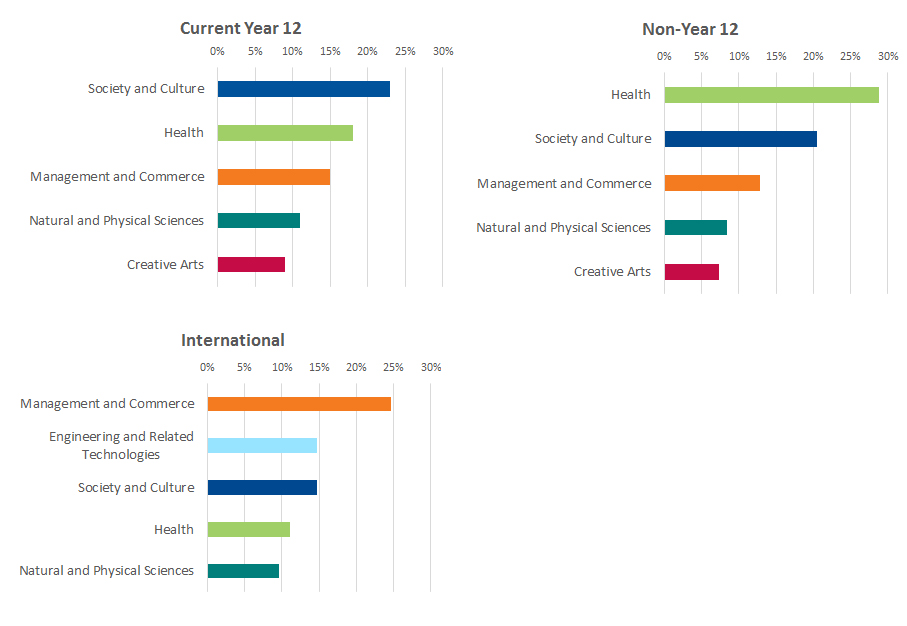
First preference analysis
Domestic undergraduate applicants can choose up to five course preferences and may change their set of preferences as many times as they like. Their first preference is the course they would most like to study. The following analyses are based on applicants' final preference sets as they stand at the end of the 2017-18 admission cycle.
Fields of study are categorised by the Australian Government. Each category is defined on the Department of Education and Training's HEIMS (Higher Education Information Management Systems) website.
First preferences by field of study
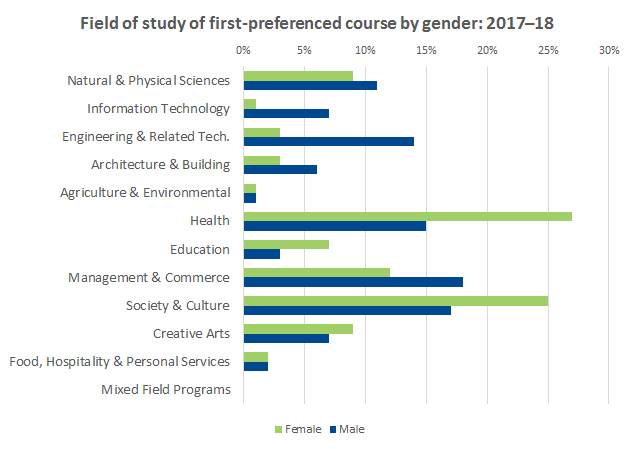
First preference by field of study and gender
For females, Health, followed by Society and Culture, were the fields of study with most first preferences. For males, most first preferences were in Management and Commerce, followed closely by Society and Culture. In general, the spread of first preference courses across fields of study was more even for males than for females.
Compared with males, a smaller proportion of females had first preference courses in Engineering and Related Technologies, Architecture and Building, and Information Technology. Conversely, the proportion of females with first preference courses in Education more than doubled that of males.
* Application and offer data don't match because even though applicants can only receive one offer in each offer round, they can receive an offer in more than one round. Read more at Offers FAQ.