Insights
Insights data dashboard
Harness the power of your applicant data
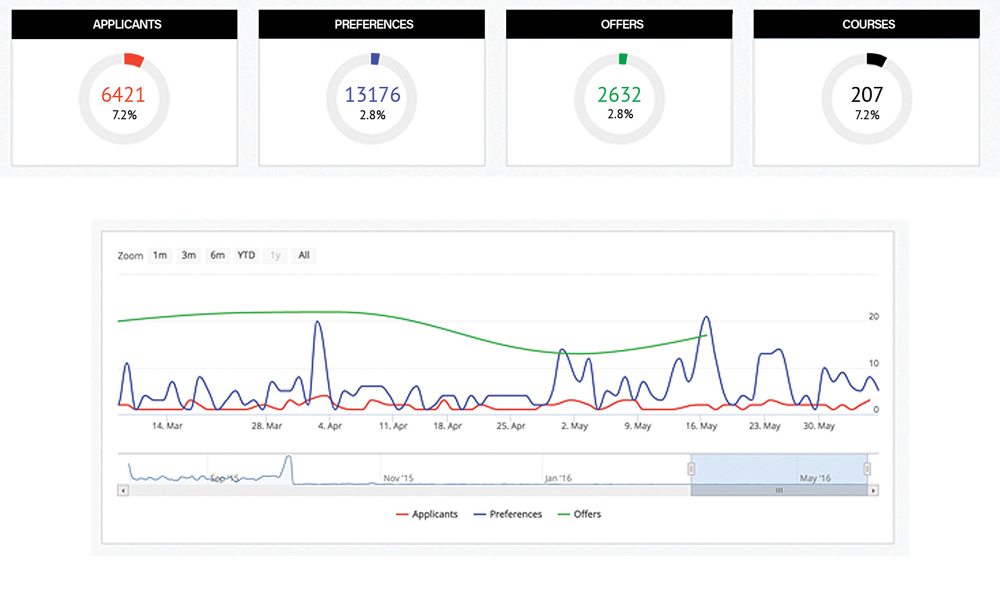
UAC’s Insights dashboard provides graphical snapshots of current and historical applicant trends, helping you to make informed decisions based on accurate business intelligence.
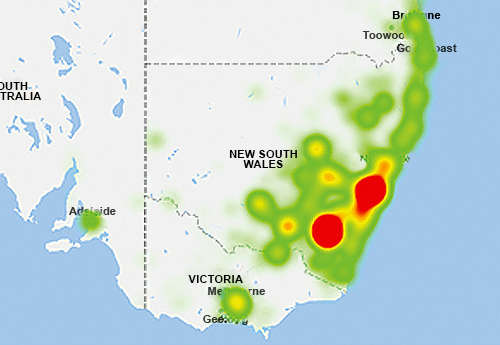
UAC captures the data that is important to you – applicant numbers, demographics, course preferences and offers – then translates it into a simple but powerful visual report to reveal admission trends and opportunities.
Data is sourced directly from the UAC live admissions environments and can also be imported from your own internal sources.
UAC’s Insights dashboard is provided on an annual subscription basis.
Data that's important to you
UAC’s Insights dashboard provides high level views of essential real-time application and offer statistics. Once you’ve assessed the big picture, the dashboard’s simple drill-down functionality provides access to comprehensive details of your applicant demographics, choices and behaviour. The features of the standard version are shown below, but for an additional fee the dashboard can be tailored to include specific data elements and comparisons that are important to you.
Benefits of the Insights dashboard
- Increases productivity by delivering instant, up‑to‑date data snapshots and business intelligence to your screen, wherever you are.
- Promotes information sharing between colleagues by allowing easy but secure online access to data across undergraduate, international, postgraduate and UAC Connect environments.
- Eliminates the need to extract and interpret raw data by producing at‑a‑glance visual presentations of performance measures and trends.
- Improves reporting efficiency by combining multiple reports into one dashboard.
- Enhances user experience through intuitive navigation and easy drill down.
- Adapts to your reporting needs with optional integration of internal data sources.
Contact us to arrange a demonstration.